What is the difference between a histogram and a bar graph?
What is the difference between a histogram and a bar graph? A bar graph compares separate categories, such as the average score of each class. A histogram shows how one set of numbers is spread out, such as where most students' scores fall. Look at the horizontal axis: names mean a bar graph; continuous ranges of numbers mean a histogram.
What are a bar graph and a histogram?
A bar graph uses separate bars for separate categories. Each bar's height is a value for that category: a total, an average or a share. Sales by region, votes per option and headcount by department are typical bar graph data.
A histogram first splits one column of numbers into ranges, called bins, then counts how many values fall in each. The bar's height is that count. Exam scores, order values, delivery times and ages are typical histogram data.
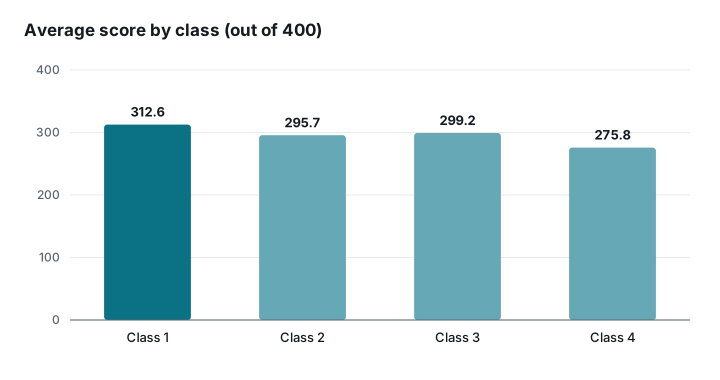
The difference is easiest to see with one dataset. Here are the final scores of 120 students in four classes, out of 400. Average them by class and draw a bar graph, and you answer "which class did best?":
Group all 120 scores into 40-point bins and draw a histogram, and you answer "what did most students score, and are there very low scores?":
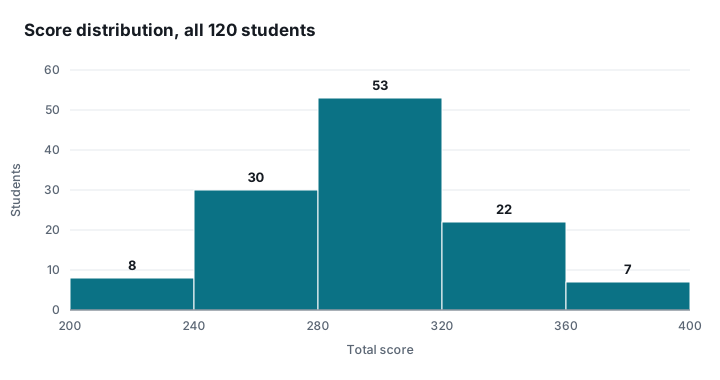
Same data, different answers. Classes 2 and 3 are only 3.5 points apart on average, yet half of Class 3 scored around 250 and half around 350. Only the distribution shows that.
What are the differences?
The core difference is the question each chart answers: a bar graph compares, a histogram shows a distribution. Everything else follows from that.
The horizontal axis differs. Each bar in a bar graph is a separate category; each bar in a histogram is a continuous range, and one range ends where the next begins. That is why histogram bars touch and bar graph bars have gaps.
The vertical axis differs. A bar graph can show any value: sales, an average, a growth rate. A histogram almost always shows a count, also called frequency.
The order differs. A bar graph is easiest to read sorted from largest to smallest. A histogram's bins must stay in numeric order; shuffle them and the shape of the distribution disappears.
A common misconception is that a bar graph without gaps is a histogram. It is not. If the axis still shows names, it is still a bar graph.
When should you use each one?
Start with what one row of your data is. If a row is a total for a region or a product, use a bar graph. If a row is one student, one order or one delivery, you most likely need a histogram.
Then ask what you want to know. "Which is biggest?" calls for a bar graph. "What is typical, how spread out is it, are there outliers?" calls for a histogram. To compare the distributions of several groups, such as each class's scores, a box plot works better. For values by month, neither is ideal: a line graph shows the trend.
In Excel the two are built differently too. A bar graph is a clustered column or bar chart; see how to make a bar graph in Excel. A histogram needs the built-in statistic chart, the Analysis ToolPak or the FREQUENCY function, plus a sensible bin width; see how to make a histogram in Excel.
Conclusion
Bar graphs and histograms look alike but answer different questions: one compares categories, the other shows a distribution. Decide which question you are asking before you pick the chart. Both charts can be made straight from a spreadsheet with SheetGlance: drop an Excel or CSV file into SheetGlance and it picks a suitable chart from your columns. The file is processed in your browser and never uploaded.
Which chart fits the data you have?
Drop your spreadsheet into SheetGlance and get a chart in seconds